
This is the story of why the Mesa engineering team ripped out Sentry and built a lightweight, purpose-built observability system for tracing LLM calls.
It may sound like a foolish endeavor. Observability is a huge category, and there are great vendors. But for our use case, the results surprised us:
- it took less than a day to implement
- it has virtually no maintenance cost
- it gives us total control over how we emit and analyze agent telemetry
- it avoids new vendor dependencies and awkward data pipelines
The trigger: we needed to explain cost, fast
In December, as hundreds of new companies onboarded onto Mesa code review, we noticed something alarming: some teams had code review costs that looked abnormally high, with an average cost per review approaching $2.00. We could see total spend, but we could not answer the questions that matter when you are trying to fix cost:
- Where is the agent spending time?
- Is it looping?
- Is a single step expensive, or is it too many steps?
- How do model choice, repo characteristics, and configuration affect cost?
The first step was obvious: better telemetry.
First attempt: Sentry spans
We started by using Sentry spans to wrap each agent step and understand whether the agent was getting stuck in doom loops or repeatedly making bad tool calls. Sentry got us part of the way there, but we quickly ran into problems:
- Even with sampling turned off, some traces seemed to be missing.
- Joining Sentry traces with organization, repo, and model price-card data in our DB was unergonomic, which made it hard to ask ad-hoc questions and test hypotheses.
This wasn't a knock on Sentry. It just wasn't optimized for LLM-agent telemetry that needs to be queried alongside product and billing data.
What we actually needed
At a high level, we wanted two things:
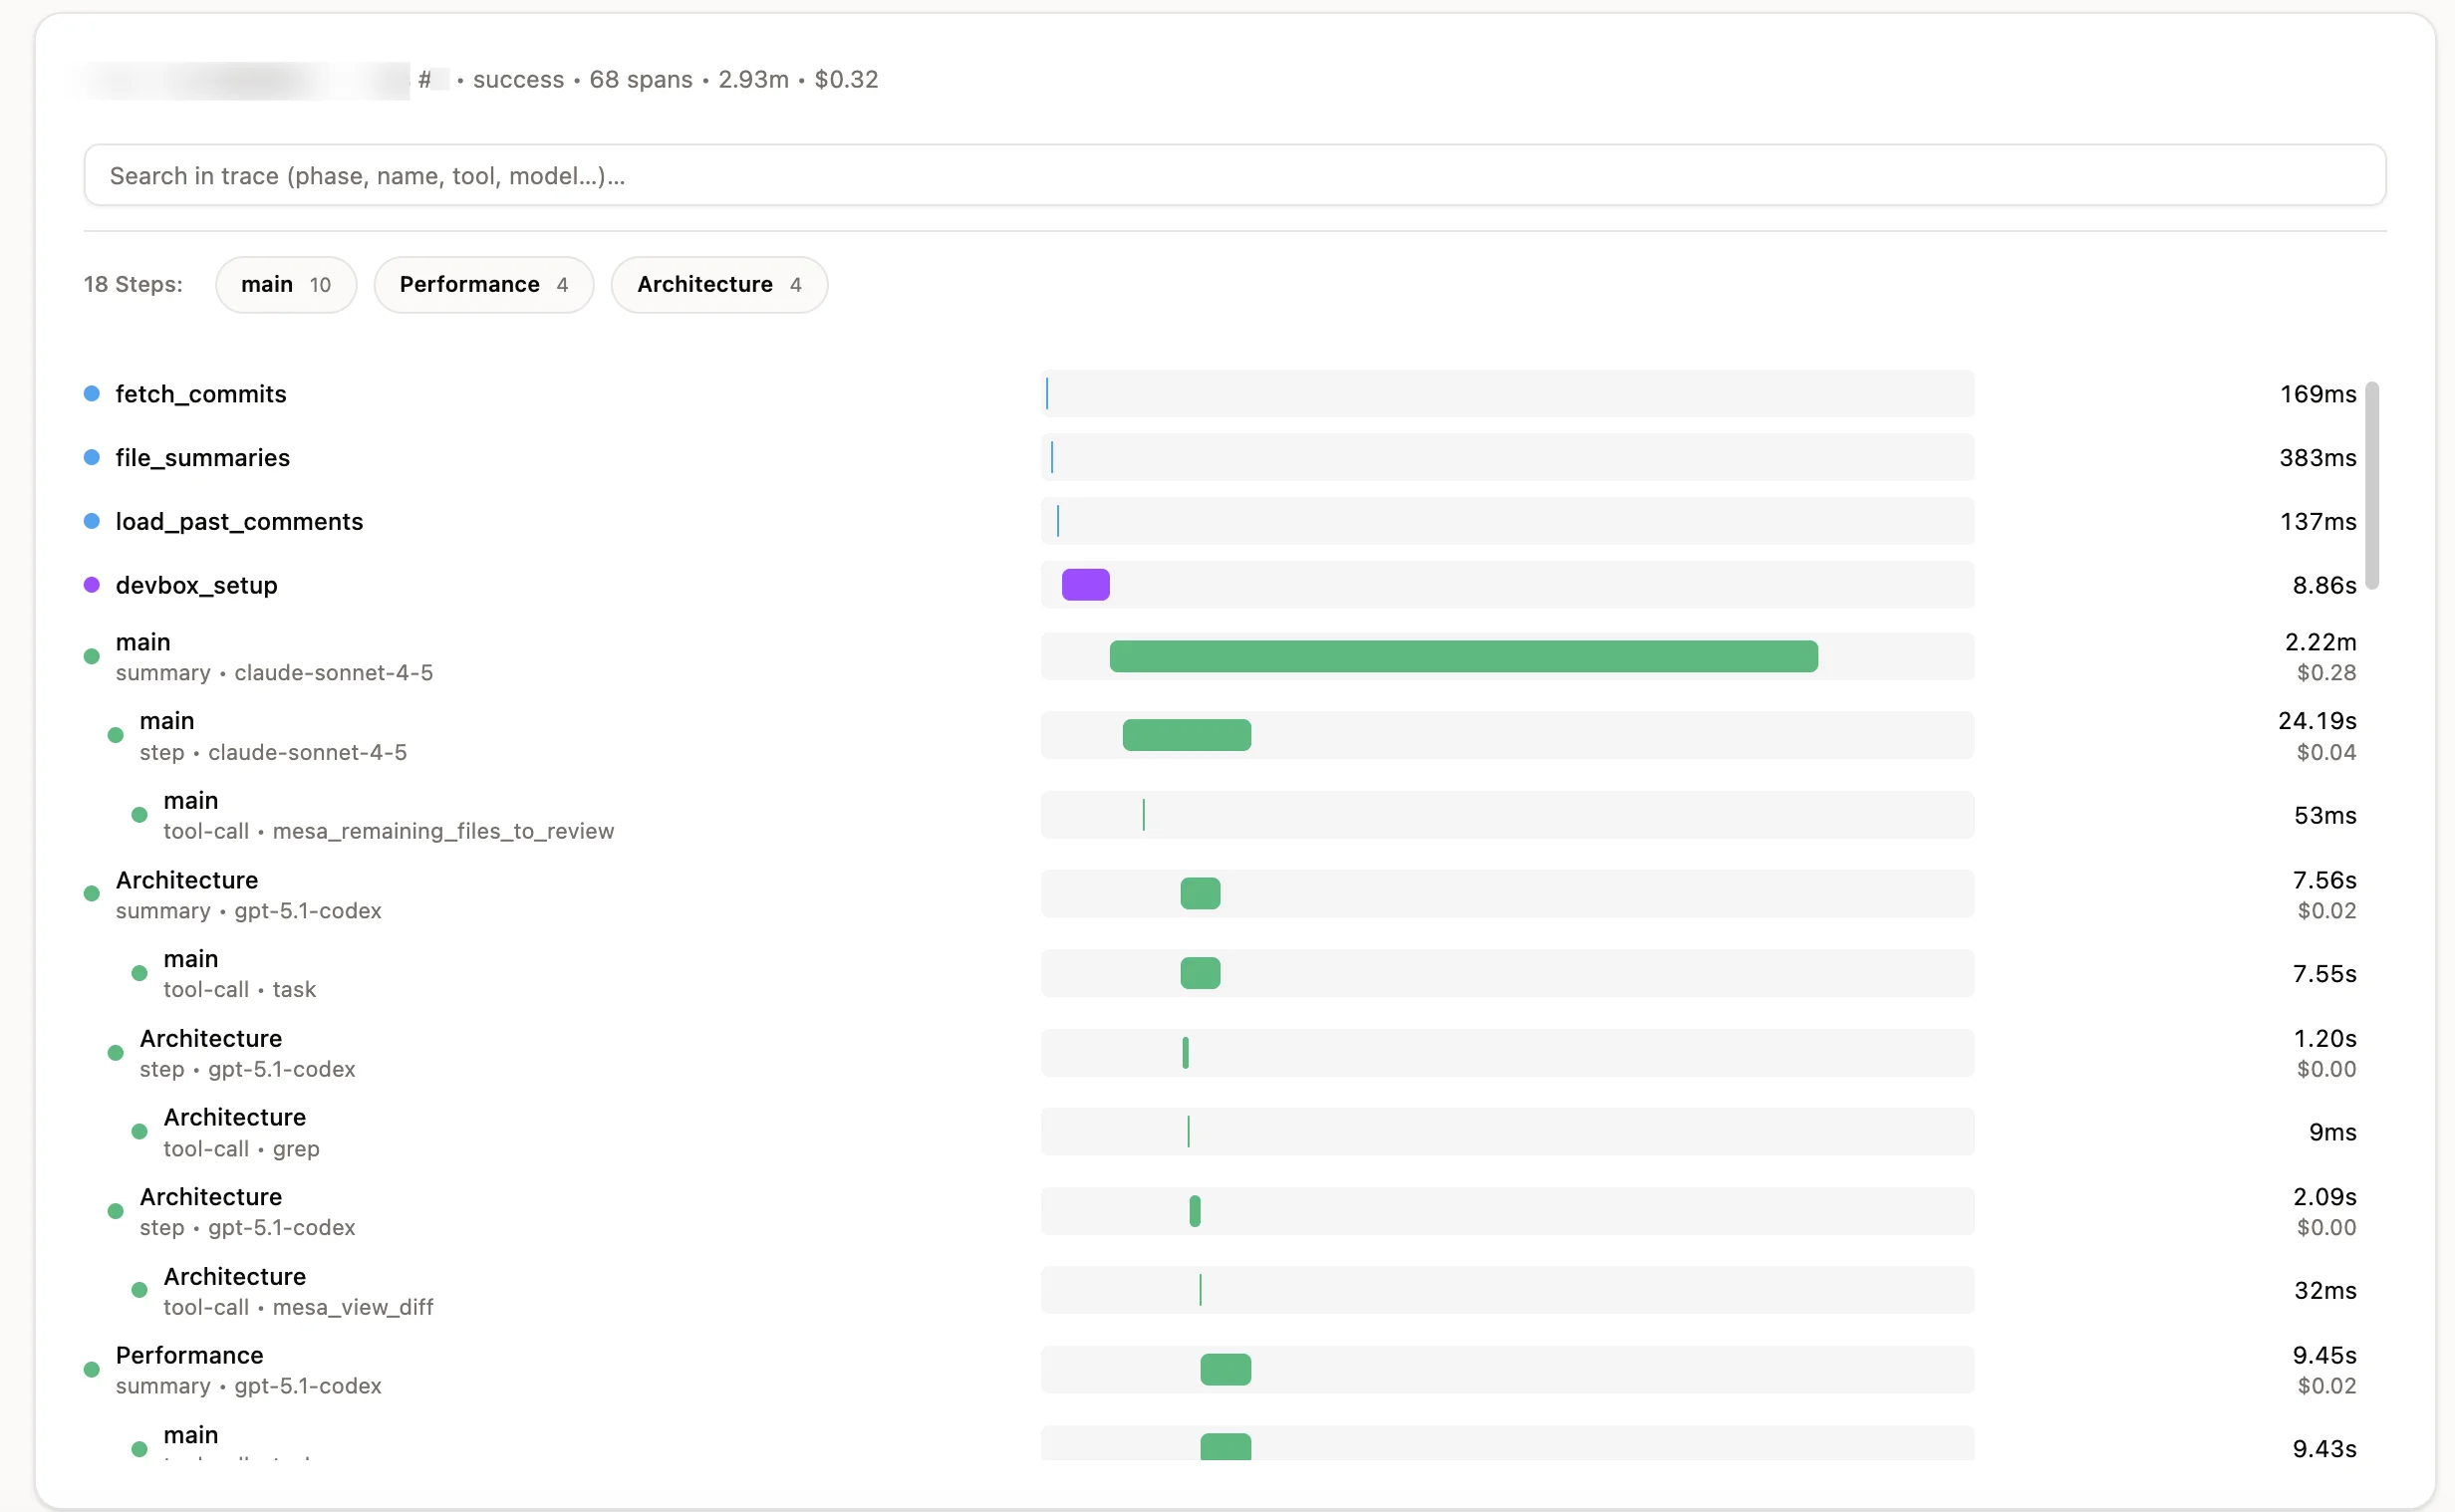
- A complete trace of each review run, at the level of phases, agent sessions, and individual tool calls.
- The ability to run whole-of-database queries over that telemetry (join it with orgs, repos, model pricing, feature flags, prompt versions, etc.) without building and maintaining an ETL pipeline.
We also knew our constraints and advantages:
- We did not need to handle massive scale yet (max 10k review runs/hour).
- We knew exactly what data shape we wanted.
- We only needed compatibility with our own stack (TypeScript, Postgres, AWS ECS).
- We wanted opinionated views of the data, and could iterate quickly.
The decision: put LLM telemetry in Postgres
We decided to treat each review run like a dataset and write traces directly into Postgres.
This is the key design choice:
Instead of shipping traces to a separate observability vendor and then fighting joins, we stored the raw, queryable event stream next to the rest of our product data.
The data model: spans as the primitive
We built the simplest possible representation of an agent trace: a review_spans table.
Each review run has many spans:
- Spans cover backend phases (
PREPARE,DEVBOX_SETUP,FILTER,FINALIZE). - Spans also cover agent execution (main agent and subagents).
- For agent spans, we store token counts, tool calls, and cost.
- For fine-grained analysis, we also store step events and tool-call events.
- Finally, we mapped agent lifecycle event fields to span attributes according to our own conventions.
Why this worked at our scale
Once we turned this on, it worked immediately. At our scale, we had no performance issues with a naïve "write to Postgres on every step" model. And we avoided a long list of operational footguns:
- sampling weirdness
- buffer flushing issues
- schema mismatches
- painful joins across systems
We captured exactly the data we needed to understand our own agent.
What it unlocked
Because the telemetry lived in Postgres, it became trivial to ask the questions we actually care about:
- scatter plots of cost vs duration
- step counts by model
- cost breakdowns by phase and agent
- cohort comparisons across orgs and repos
We spun up dashboards quickly (we used Hex BI) and could iterate directly from hypothesis to query to visualization. This instrumentation loop is what ultimately enabled us to identify and ship the model-default change that drove a major cost reduction.
Takeaways
- Treat telemetry as first-class product data.
- Storing traces alongside your product database can be the fastest path to insight.
- "Build" is sometimes cheaper than "buy" when the scope is narrow, the data shape is known, and iteration speed matters.
Related
If you want the full investigation story and the cost reduction results, see: Using an expensive model made our agent 75% cheaper.